Americans are as unhappy as ever. Could ‘a happiness-segregated society by marriage’ be why?
Americans went through a “happiness crash” right after the pandemic. The ones who are married are the only ones who really recovered.
For nearly 50 years, one number barely moved. Every year or two, the General Social Survey asks Americans how happy they are, and for decades the balance between “very happy” and “not too happy” held steady, from 1972 through 2018. But as soon as the pandemic hit, it came cratering down.
Sam Peltzman, an economist at the University of Chicago’s Booth School of Business, has spent several years tracking that number. “It’s a huge change,” he told Fortune. “It always can come back more, and we hope that it does. But so far, it’s like a net of minus 20, which is utterly unprecedented.”
The 2020 drop was 25 points, but the rebound has only been 5 points. He compared it to the last shock most Americans lived through: the Great Recession, which he said “was maximum 10 points, and came back right away.”
The first instinct is to blame money, but Peltzman says it’s not that simple. Yes, while grocery bills and gas prices have soared, blaming the affordability crisis would make sense if the unhappiest Americans were the ones getting squeezed hardest.
But Peltzman’s data says the opposite. The people who fell furthest after 2020 were the ones who had the most going in: white, high-income, college-educated, right-leaning Americans. “The affordability business is not an upper-income kind of concern,” he said. “It’s a lower-income kind of concern, and the upper-income people have been hit hardest in the happiness crash.”
“Any story which says that it’s inequality,” Peltzman said, “those kind of stories are not consistent with the facts.”
‘We have a happiness-segregated society by marriage‘
Married people are still, on net, happy. Unmarried people, about 45% of American adults, are now, on net, unhappy. “The only people who are positive, where there’s a clear positive balance in happiness, are married people,” Peltzman said. “We have a happiness-segregated society by marriage.”
The obvious next question is whether this is just the marriage rate falling and the crash is only picking that up. It isn’t. The marriage rate itself hasn’t moved in 15 years: “It’s 55/45, and it’s been that way,” Peltzman said. Marriage rates did decline for decades, from the 1970s through the early 2000s, and in an earlier paper, Peltzman found that decline explained most of the happiness slide that came before the pandemic.
But that slide had already leveled off well before 2020. The country’s split between married and unmarried adults going into the crash is the same split as today. What changed was not how many people are married, but how much worse it now feels to be unmarried, while married people mostly held their ground.
While both groups took a hit, “if anything, the unmarried were hit a little bit more,” Peltzman said. Married respondents went from roughly +30 to +50; unmarried respondents went from near break-even to about -15. But still, “you can’t infer what’s causing what.
In another paper entitled “The Anatomy of Marital Happiness” (2025), he found the same marital premium holds across nearly every group he tested: age, race, income, education, sexual orientation. Cohabiting couples get a smaller version of the same boost, about 10 points. “Happy people get married, and married people become happy,” he said. “So don’t run out and make any personal decisions on the basis of this.”
Brad Wilcox, senior fellow and director of the Get Married Initiative at the Institute for Family Studies (IFS), said economic pessimism is a likely contributor to the increase in unhappiness as young people fear inflation and housing costs have put the American Dream out of reach.
“But the negativity bias of social media and declines in socializing, dating, and marriage loom larger in this happiness crash,” he added. “That’s because, objectively, young adults’ social ties have declined much more than their economic position in recent decades.”
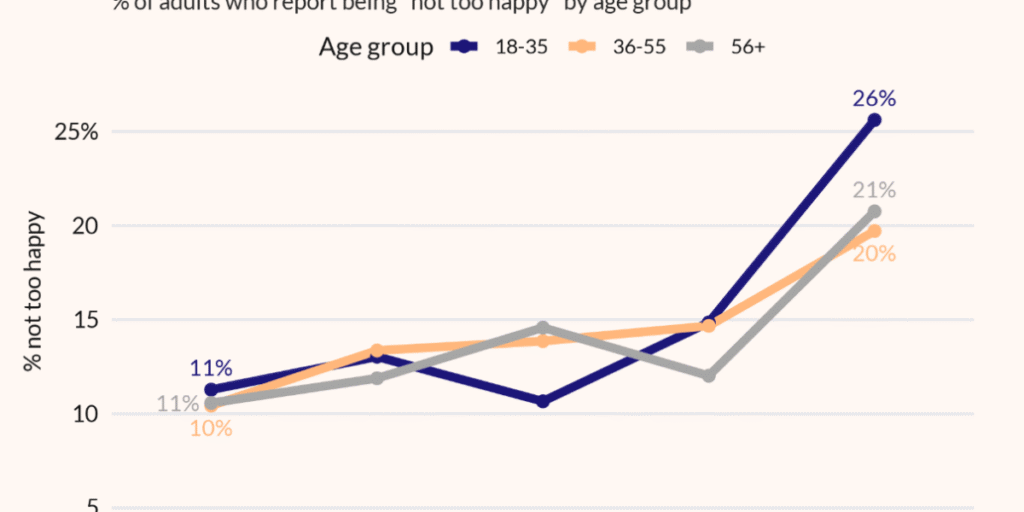
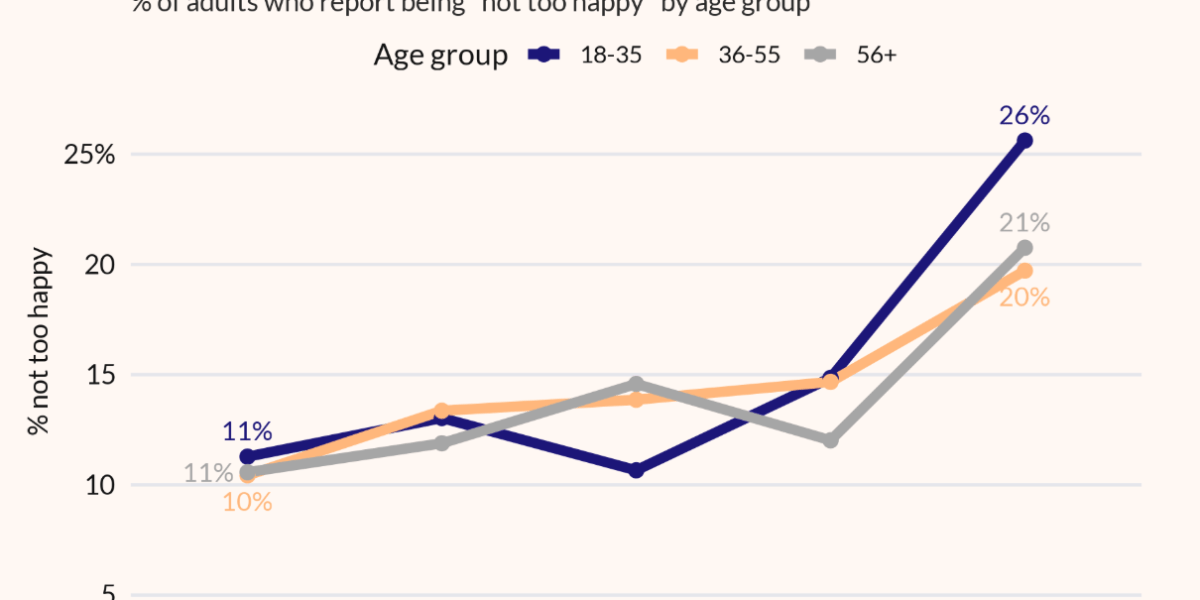
An IFS chart built from the same General Social Survey data shows why young adults draw special attention. From 2000 through 2019, unhappiness across every age group tracked in a tight band, roughly 10% to 15% reporting “not too happy.”
But from 2021 to 2024, 18-to-35-year-olds jumped to 26%, against 20% for the middle-aged and 21% for adults 56 and up, though Peltzman noted younger people are a very volatile group.
His research turned up one more data point that moved in step with happiness: whether Americans believe other people treat them fairly. That number crashed the same year, by the same scale. “It’s like the social glue is coming apart,” he said.